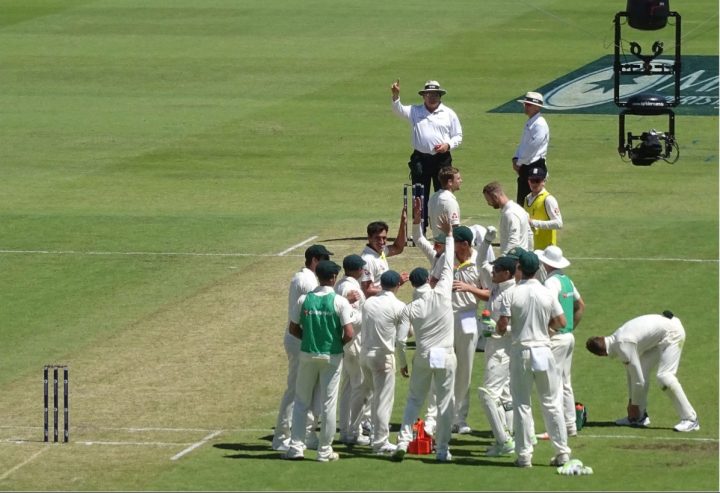
Andrew Strauss and the England cricket team fly out to Australia today with the hopes of the nation on their shoulders. The pre-tour interviews have been done, the WAGS have been kissed goodbye, KP has packed his twenty gallons of Red Bull, and Stuart Broad has slipped his anger management self-help guide into his hand luggage.
The first ball of the first test is now under a month away – and normally we’d say that England’s first embarrassing tour defeat, usually at the hands of a motley crew of bush league players and over-weight former stars, is just around the corner. However, we’re all a little more optimistic this time. Expectations aren’t quite at pre-football World Cup levels, but that’s probably a good thing; and at least the chances of Andrew Strauss sleeping with Chris Tremlett’s ex-girlfriend are slimmer than your average underwear model.
On Wednesday we discussed the batting averages of both teams in an attempt to see if England fans’ optimism is justified. The result? We proved sod all. The consensus was that averages are only important if they’re a fair reflection of recent form (which in this instance, they weren’t). But what about the bowling averages – perhaps they’re more revealing? See what you think …
Ben Hilfenhaus 48 wkts at 31 James Anderson 188 wkts at 32
Peter Siddle 60 wkts at 32 Stuart Broad 97 wkts at 34
Mitchell Johnson 166 wkts at 29 Steven Finn 32 wkts at 23
Nathan Hauritz 63 wkts at 35 Graeme Swann 113 wkts at 27
(Marcus North) 13 wkts at 37 (Paul Collingwood) 15 wkts at 63
(Doug Bollinger) 49 wkts at 24 (Chris Tremlett) 13 wkts at 30
(Steve Smith) 3 wkts at 27 (Monty Panesar) 126 wkts at 34
Once again you’ll see that the teams are boringly well matched on paper. You couldn’t put one of Tony Grieg’s car keys between them. If we accept that Steven Finn’s average is a little flattering, as many of his wickets were taken against Bangladesh, there is nothing to choose between the seam attacks. What the statistics do suggest, however, is that Graeme Swann could give England an edge.
The primary weakness of the averages is that they don’t reflect home advantage. The Aussie seamers, particularly Mitchell Johnson, always raise their game in front of the Aussie fans. James Anderson, on the other hand, has a terrible record outside England. Try as he might, Jimmy hasn’t been able to pack up a green English wicket and take it with him (apparently British Airways charge too much for excess baggage). Meanwhile, everyone knows the Kookaburra ball stops swinging after a few overs. Consequently, the onus could be on Broad and Finn to hit the pitch hard and keep the Aussies hoping around.
So what do the statistics tell us? Basically we’re back to square one. Whichever team wins the crucial tosses and plays the key moments well will probably win the series. Next week, in order to inundate you further with meaningless facts and figures, we’ll look at the world test rankings of each individual player. Perhaps we’ll also look at the height of each team, the weight of their bats, the number of studs on the players’ boots, and the average waistlines of selectors (taking into account, of course, that Big Merv has just been dumped from the Aussie panel). If you’ve got any other ideas as to what statistics could prove to be crucial, or utterly meaningless, let us know.
James Morgan


